Queen's plate 2020 through a Bayesian Lens
2020-09-11
The motivation
As a new experiment, since I decided to try my hand at using the Bayesian statstics library PyMC3 this summer, and have been down on my luck with respect to horse racing, I wanted to build a racing model that purely used speed figures to determin win probabilities.
The problem
Models that I have built in the past are often extremely difficult to interpret. As a result, they are difficult to get people to understand. When someone would ask the question - "well, what factors do you consider in your model" my response was almost always - "a bunch of stuff - you know, the standard stuff..." Not overly helpful to the inquisitor.
The Bayesian statistical way of building a model tends to make things much more interpretable, so long as you know some statistics.
The solution
I decided that the model should consist only of speed figures. I actually got the motivation for this model when I was reading about Hierarchical Partial Pooling on the PyMC3 examples page. I wanted to model future speed figures as a function of past speed figures for any given horse.
The logical next question is: How might one go about doing this? The answer to me, was assume that each horse's future races will be drawn from the distriution of the horses previous races. The distribution for each horse, in this rough cut at the model was simply a Normal Distribution. So the model is formed as follows:
The mean of the normal is assumed to be unique to a horse and is generated from a Uniform distribution with a lower bound of 0 and an upper bound of 120. The lower bound is simply the lower bound of my speed figure model, and the upper bound was the maximum value any horse in my database had ever attained.
The standard deviation of the normal, at current state, is assumed to be also be drawn from a Uniform distribution. However, in contrast to the above, I assumed that each horse did not have a unique standard deviation, but each horse in the race would share the variance. I did this in part just to experiment with partial pooling, but also because I thought it might make some sense. I considered an example of a maiden race, versus a stakes or allowance race. In one situation, horses have very little experience. In other cases, they have potentially a lot of experience. The confidence in the prediction should reflect the experience of the runners in the race, but not so much so that first time starters have so much variance that they are assumed to be able to run almost every single speed figure (which is what I found when I tried to model variance at the horse level). In any case, portion of the model needs some more thought and experimentation, but in the interest of getting a prototype together this worked rather well.
The model
As a result of having run this model for each horse in the Queen's Plate which will take place at Woodbine on September 12th 2020, I got the following outputs:
Each distribution in the "means" quadrant represents a specific horse's mean speed figure. Rather than a point estimate however, PyMC3 allows for an estimate over a distribution. We can speak about this more later.
The same is true for the standard deviation. Note here that there is only one distribution estimate (there are a few lines there, but it is the estimate across a number of cores on my computer all representing an estimate of the same parameter).
The bottom line
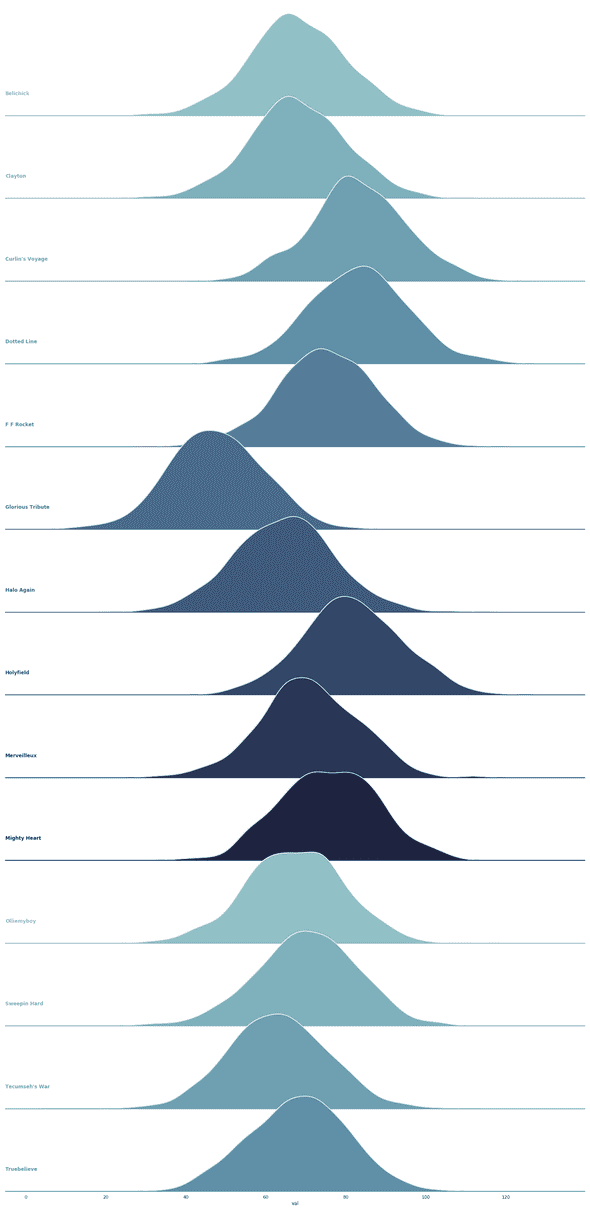
The outcome of all of this means I can use the mean and standard deviation for each horse, and use monte carlo simulation to simulate the running of the race. If I simulate each horse in the race 100,000 times, and take the maximum speed figure in each trial, I can tally the number of simualted "wins" for each horse, and convert that to a probability of each horse winning the race.
Those 100,000 simulations can be represented with the following graph (it's smoothed keep in mind):
And also in the following chart:
| Horse name | Probability to Win |
|---|---|
| Curlin's Voyage | 23.06 |
| Clayton | 22.32 |
| Halo Again | 19.09 |
| Merveilleux | 9.62 |
| Dotted Line | 8.08 |
| Holyfield | 3.96 |
| Olliemyboy | 3.11 |
| Tecumseh's War | 2.53 |
| Belichick | 2.22 |
| Truebelieve | 1.93 |
| Mighty Heart | 1.87 |
| Glorious Tribute | 1.31 |
| Sweepin Hard | 0.89 |
| F F Rocket | 0.01 |

