NFL 2020 Quarterback Fantasy Output
2020-08-20
Quarterback fantasy point distributions - 2020
I thought it might be interesting to view "learned" point distributions for each quarterback in the NFL. The mdoels were trained on play by play data from the NFL from 2014 to 2019.
Assumptions
Each quarterback is assumed to have Fantasy Points (using DraftKings player points) that come from a gamma distribution and each quarterback is assumed to generate data from Gamma distributions with different alpha and beta parameters.
The model spec is below:
Modeling
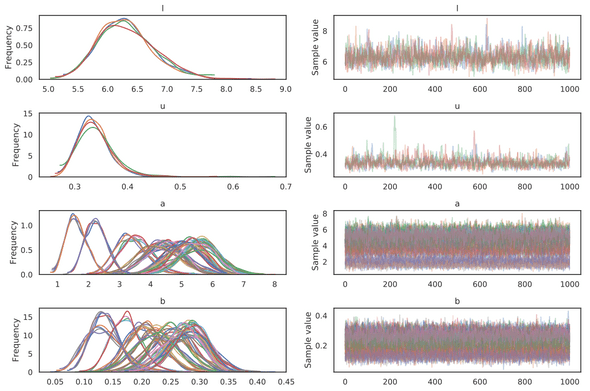
PyMC3 is used to infer the parameters for each quarterback. The output from PyMC3 is displayed below. It's extremely interesting to see how the data appears to be generated from very different Gamma distributions based on the quarterback in question. The plots on the left hand side display how different some of the quarterback's alpha and beta parameters are from one aother.
Results
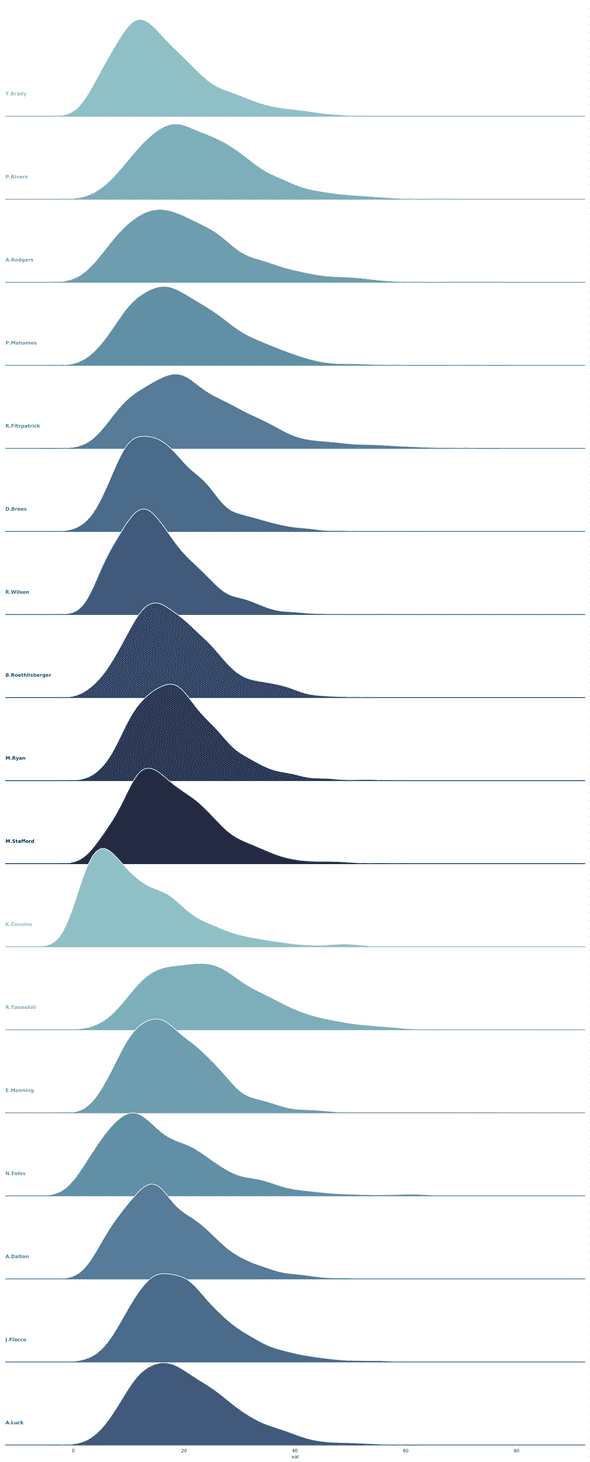
After the distributions are specified for each player, we are able to randomly sample from the distribtuion to understand over 1000 games how each player would perform.
The following plot summarizes each player. Distributions that are spread out across the x-axis more than others suggest that players have high ceilings for fantasy points and could overperform. The sword does cut both ways in that they also have a higher likelihood to underperform.
Players with higher peaks tend to consistently score points that are closer to their average points.
Ryan Tannehill for example appears to be one of the better selections in quarteback given his high variance if you're trying to potential catch him in a week where he outscores his peers.


